
Matomo is an open source web analytics platform which can be self-hosted on your own web server. It’s getting more and more popular as privacy in the web is evolving. I recently had a client who has switched from Google Analytics to Matomo. But they were missing some of their reports they had created in Google Data Studio.
This is where Metabase comes into play. It is an open source business intelligence tool which can be self-hosted like Matomo. In this guide I will show you how to use Metabase as a Google Data Studio replacement together with your on-premise Matomo installation.
Why connect Metabase & Matomo?
There are more and more privacy concerns about sending your visitor data to the big tech companies. The reason is they use your data (and your customer data) for their own purposes. As a result an increasing number of companies is looking for alternatives to take back control and ownership of their data.
A good open source analytics system is Matomo. It was formerly called Piwik and it is out their for years. The on-premise version of Matomo can be self-hosted so no third party receives your data. While Matomo offers various built-in reports it is lacking some advanced reporting capabilities.
But here is the good thing. Since you are running it on your own server, Matomo’s SQL database with all your raw data is at your fingertips. Now you can use Metabase to visualize your analytics data in and create your own dashboards. Metabase has the same open source spirit like Matomo and can also be self-hosted. So both tools combined can give you a really powerful analytics system.
Connect Metabase to Matomo database
Before you can start creating beautiful dashboards in Metabase you need to make some prerequisites on both sides.
Matomo prerequisites
We’ll assume your Matomo setup is working as expected and running for at least a few weeks. This is necessary so we can view some historical data. Metabase needs access to your Matomo database (whether MySQL or MariaDB).
The simplest way here would be to use the same database credentials you set up in your Matomo configuration. But for security reasons I strongly recommend to set up an additional user with only read-access. So you can’t mess up your Matomo database by typing a wrong SQL query in Metabase.
Metabase prerequisites
We’ll assume you have at least a basic installation of Metabase running. Then open the admin panel and click on Databases > Add Database.
Here you need to fill out all the connection details to your Matomo database server. My demo setup is hosted on DigitalOcean so your details may vary according to your hosting provider.

As you can see I also entered something in the last field:
Additional JDBC connection string options: useSSL=true&enabledSslProtocolSuites=TLSv1.2
These parameters were required for a long time to use an SSL encrypted database connection. But in one of the latest Metabase updates a simple toggle switch (below password field) was introduced to achieve the same thing.
View Matomo tables in Metabase
Now comes the part where it gets interesting. In Metabase click on Browse Data and you can see the previously connected Matomo database. Click on this database and you can see your Matomo tables.

With default configuration you will see a lot more tables here as Matomo creates additional archive tables for every month. These can be hidden in the Data Model configuration of Metabase which I have done here to only see the most important tables above. But they do not bother either.
In this tutorial we will visualize the website visits. These are stored in the Matomo Log Visit table. When you click on this table you can see the stored rows.

Now you know how to access the raw data tables of Matomo in Metabase. Before we can create our first query you need a little understanding of the Matomo database schema. This is outlined here in the developer docs. When you see this first it can be a bit overwhelming but don’t worry. Once you have created your first queries you will become a better understanding about the details.
These are the most interesting tables:
- matomo_log_visit: stores all visits (sessions)
- matomo_log_link_visit_action: stores all actions per visit
- matomo_log_action: stores action types (pageview, event…)
Create custom queries
Now let’s create out first query. Metabase offers three types of query builders. In the previous chapter we already used a simple question to view the table rows.

Custom question
Here we will create a custom question. Choosing this option opens up the graphical query builder. In Metabase a query is called a question. In the beginning that sounds a little bit confusing but you will get used to it. In the query builder interface we set up four parameters:
- Data: select the Matomo Log Visit table
- Summarize: add Count of rows option here
- by: choose Visit First Action Time field here
- Filter: optionally add a date filter here

When you’re ready click the Visualize button at the bottom. Now Metabase will execute a query to your configured Matomo database and creates a beautiful graph with the result set.

I recommend you to play around a little bit with the different options in the query builder. There are lot’s of things to explore here 🙂 Also in the visualization you can click on the two buttons in the lower left corner to customize the graph to your needs. Once you’re done you can Save this question for later use. On top of that you can also put all saved questions on custom dashboards.
Native query
The graphical query builder is a cool thing of Metabase and it has become much better over time. But it is still buggy in some situations and has it’s limitations when doing more complex queries. So in these cases I often chose to work with the native query builder instead.
Here you can run every query your underlying database understands. But you still have the same visualization options for the result and can save every query for later use or to place on a dashboard.
So let’s create our first native query by clicking Ask a question > Native query. This will open up the following editor where we can insert the SQL.
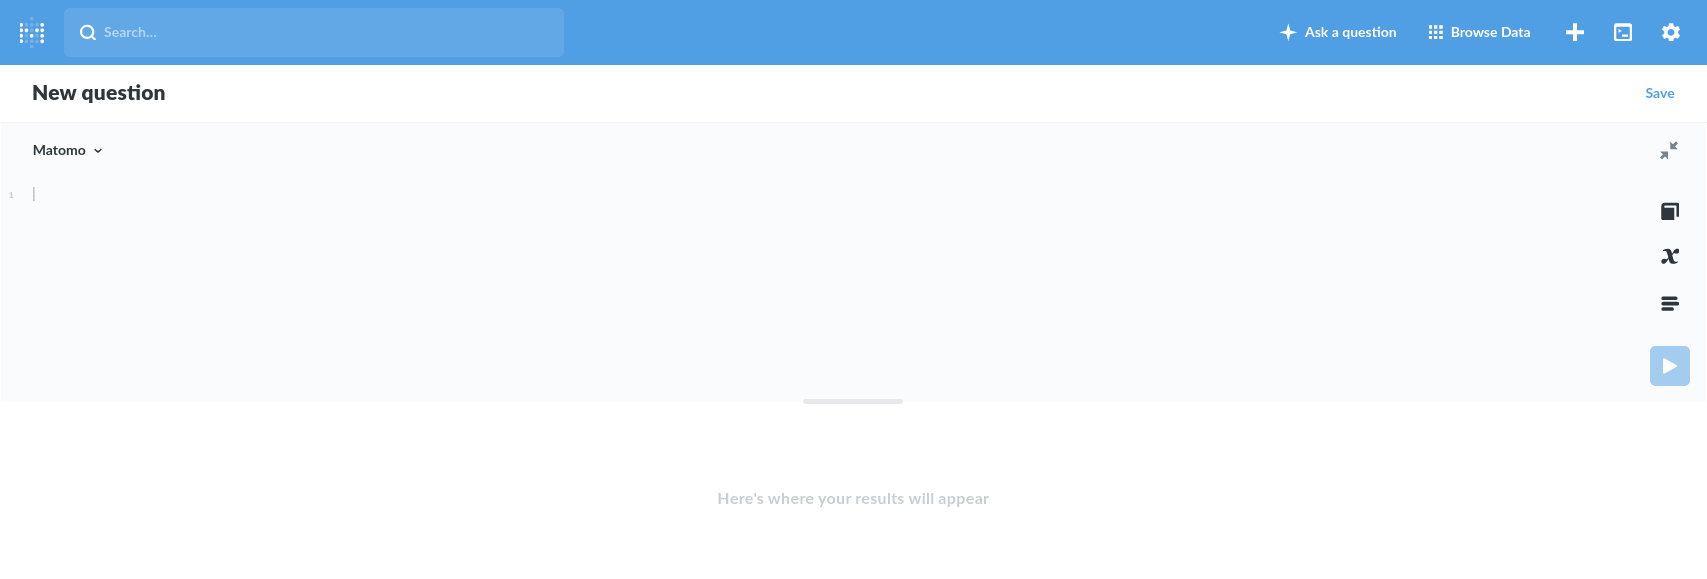
To understand how things work we will do the same query as before in the graphical query builder. We want to get the visitor sessions from the Matomo database for September 2020. The following query selects and counts the visits (sessions) in the defined date range and groups them by date.
SELECT DATE(visit_first_action_time) as visit_date, COUNT(*) AS visits

FROM matomo_log_visit

WHERE visit_first_action_time between '2020-09-01' AND '2020-09-30'

GROUP BY DATE(visit_first_action_time)
ORDER BY DATE(visit_first_action_time) ASC
Code language: SQL (Structured Query Language) (sql)
After entering the query in the editor we click the Run query button in the right sidebar. Now the query is run on the database and the result is shown below the editor. Here you have all the same customization options as before in the graphical query builder.
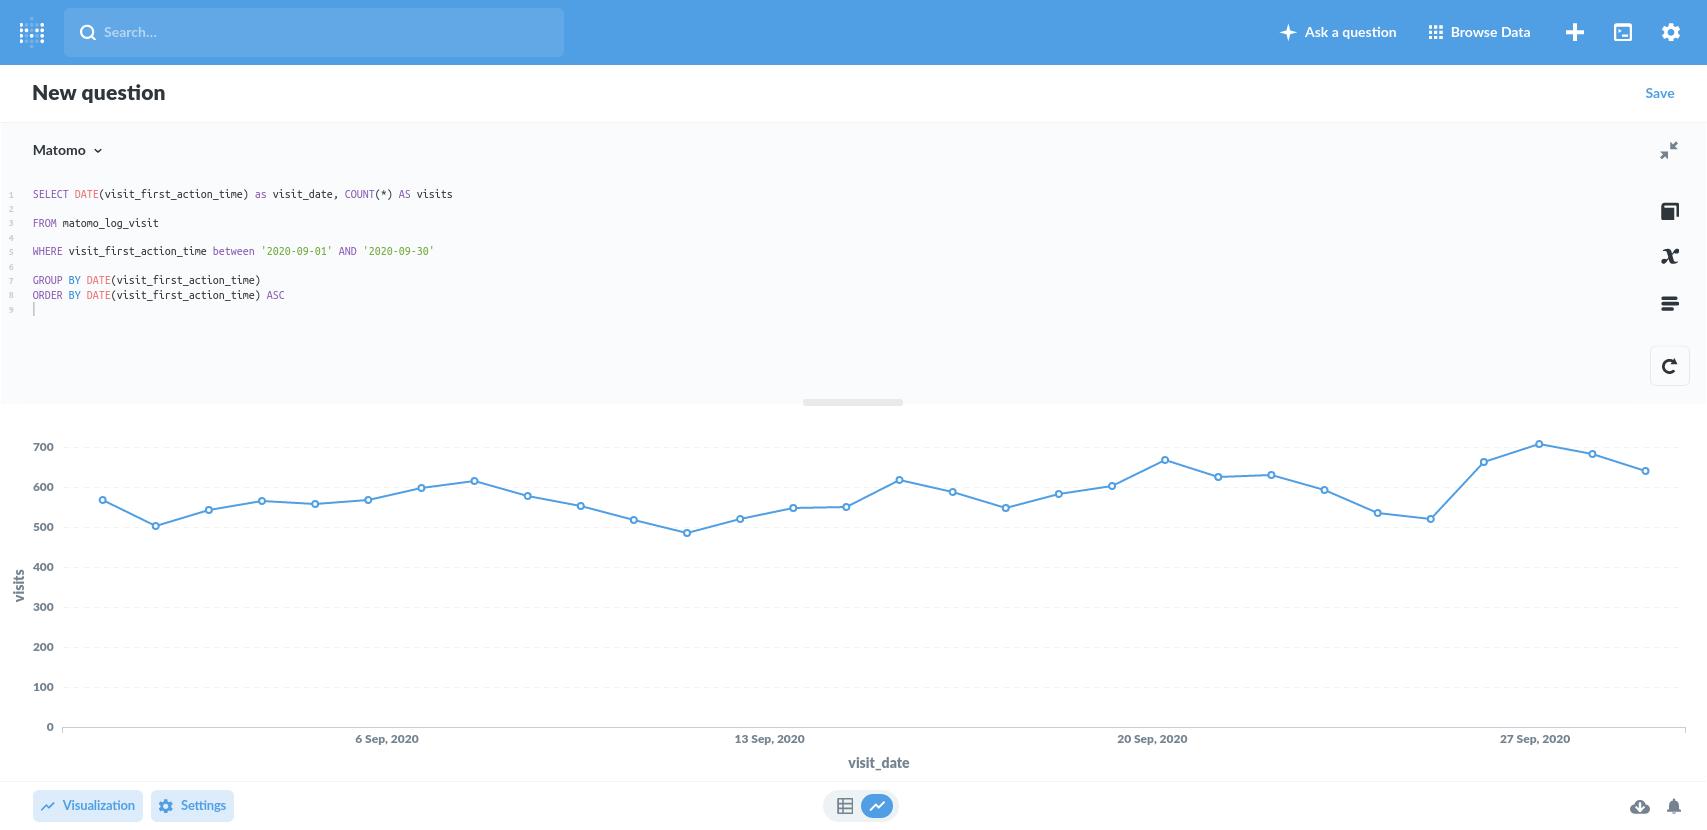
This obviously was a very basic query but it helps to understand how things work. In the last step I’ll show you a little more complex query: Here we want to get sessions and unique visitors for a specific site and date range.
SELECT DATE(visit_first_action_time) as visit_date, COUNT(*) AS visits, COUNT(DISTINCT idvisitor) AS unique_visitors

FROM matomo_log_visit

WHERE {{idsite}} AND {{date_range}}

GROUP BY DATE(visit_first_action_time)
ORDER BY DATE(visit_first_action_time) ASC
Code language: SQL (Structured Query Language) (sql)
Line 5 of the query is where the magic happens. With {{idsite}} and {{date_range}} we insert two Metabase variables from the type field filter. In the right pane of Metabase these variables need to be mapped to the fields Idsite and First Visit Action Time.
Then above the query editor two filter fields will appear. Here we can enter the Matomo site id and a custom date range. Metabase will dynamically include the field values into the query.

The visualization now shows visits (sessions) and unique visitors for a specific site in our Matomo installation for a specified date range. As I first found out about these field filter variables I thought that is really cool 🙂
Conclusion
Now you know how to query Matomo raw data from Metabase in both the graphical and SQL query builder. I hope this tutorial helps you to understand the big picture here. Connecting Matomo with Metabase gives you a powerful marketing tool stack. And the real magic happens when you add more data sources like your CRM to Metabase and place all important metrics in custom dashboards.